Instructional – Preparation for Creating a Logo and Infographics
Instructional
•\ Recipes
•\ Product assembly
•\ Complex technologies made easier to understand (cars, electronics, and robotics)
This is not necessarily an exhaustive list; it merely just shows there is a wide range of topics that you can draw from if you want to start creating an infographic.
However, there may be some topics that are easier than others to explain as infographics. Nevertheless, being creative in your display and researching the topic is important as we will look at in the next section, later chapters, and Volumes 2 and 3. Other topics may not be that interesting for the general public to pay attention to and so may not result in a highly successful infographic. It’s all in how you arrange the topic. For example, what would be more interesting to the public, knowing visually about the history of the fax machine or the general history of technology which might include one reference to the fax machine? Again, topics to avoid would be those that have a discriminatory bent that draws attention to things like intellect of a specific race or demographic such as making the data appear like some people are more superior than others in a specific field. These would likely bring up negative connotations and emotions.
Collecting Your Data
As you collect your data for your infographic from various sources such as libraries, books, and your client’s data, as well as other sources, you need to consider the sources of the data and how it will be applied to the infographic and the information you are trying to convey. Refer to Figure 2-69.

Figure 2-69. Illustration designers in a team researching their data for infographics
Here are some things to consider:
Will the data match the infographic I am creating? This might be something you may not know until you start designing, but if the client has given you some preliminary ideas of what they would like, do they match the data? Refer to Figure 2-70.

Figure 2-70. Illustration of missing data in a pie and bar (column) graph
Is the data misleading? If you find that as you create the infographic with data that is not clear, appears to have missing gaps, areas of no value, or adds up incorrectly, then you need to express this to your client. Consider with your team or client ways to get the missing information or ways to make it more relevant to the audience. If the topic is not particularly interesting, how can you creatively make it exciting without losing the truth and ensure the facts are clear? Refer to Figure 2-71.
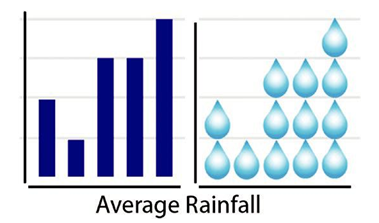
Figure 2-71. Illustration of a column graphic regular and more creative with the same data
You may have to do your own research on this topic as long as you let the client know that this is part of the budget and timeline.
Also, as mentioned earlier, as you review the data, try to eliminate data that may bring up negative connotations or emotions with the general public, but always discuss your reasons with the client.