2001 AD–Present and Modern Infographics – What Are Infographics?
The 2000s and onward have seen many types of infographics being able to be produced more quickly using computer programs like Adobe Illustrator, which allows us to create scalable versions of a design, and Adobe Animate (formerly known as Flash until 2016), which allows us to animate those drawings. Other Adobe applications also added further 3D and video options for the graphic designer. Refer to Figure 1-28.
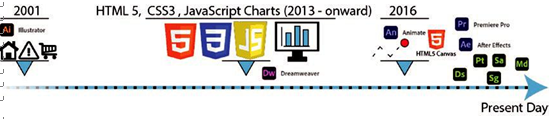
Figure 1-28. Pictorial timeline of 2001 AD to the present
For your website coding with HTML 5 and CSS3, along with JavaScript (jQuery) and Chart.js libraries and plug-ins that allow us to create charts and graphs quickly to display data in real time along with interactivity, I will discuss this more in Volume 3 in regard to Adobe Dreamweaver.
These are just some of the many innovations in recent years that have allowed graphic designers to display information visually on websites and various social media networks.
You can find more historical people and links to other historical information on the following page as well as searching on “infographic history” using your preferred search engine:
https://en.wikipedia.org/wiki/Infographic
How Did the Logo Come Along with the Infographic Historically?
The word logotype or logo originates from Ancient Greek words λόγος (lógos) meaning “word, speech” and τύπος (túpos) meaning “mark, imprint.”
Infographics and logos for the most part were developed side by side.
For thousands of years, individuals and organizations have created a graphic mark, emblem, or symbol (whether it be abstract or figurative) to be used to aid and promote their public identification and brand recognition.
Ancient logos were often more pictorial and were imprinted into clay tablets, wax, or metal coins. The carved cylinder or stamp seal that contained the logo was often made of wood, stone, ceramic, or metal. Refer to Figure 1-29 and Figure 1-30.

Figure 1-29. Pictorial example of clay rolled with pattern from a cylinder or stamped seal
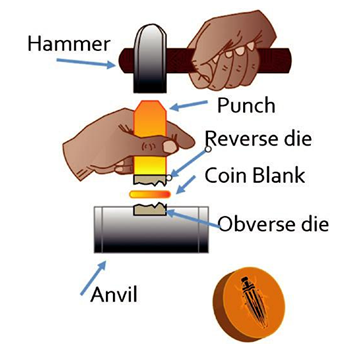
Figure 1-30. Creating a metal coin
However, what we consider modern and abstract logo design did not occur until the 1800s. Earlier in this chapter, we saw how this was true with the infographic as the distinct type of chart or graph we see begins to emerge. Logos and infographics became more standardized due to the improvement of printing techniques such as hot metal type settings and later offset lithography. Modern printing allowed logos to be mass produced as words and symbols could be cast or plated together as one unit or moved around to be added to another location in the page layout before printing begins. And so it was with infographics that could more easily appear in books, magazines, and other publications. Refer to Figure 1-31.
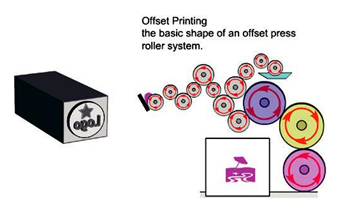
Figure 1-31. Pictorial example of metal type logo and offset press roller system
Later, in the electronic age of the 1950s, logos appeared more prominently on television, and some animated infographics in the form of cartoons appeared as well in advertisements.
By the 1980s, computer applications such as Adobe Illustrator were created that allowed the graphic designer to easily create and edit a logo as well as an infographic. Logos appear today on many web and social media sites, often with bold and simplified designs, which are easily recognizable, no matter what digital viewing platform you are using. Refer to Figure 1-32.

Figure 1-32. Pictorial examples of some common social media logos
Here we can see a timeline of the logo in relationship to the infographic. Refer to Figure 1-33.
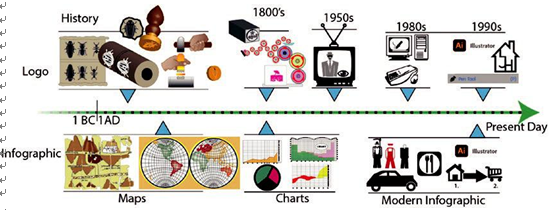
Figure 1-33. Pictorial timeline of the logo and infographic developing together over thousands of years