1901 AD–2000 AD – What Are Infographics?-2
More on Kahn’s work can be found on this page: https://hekint.org/2022/03/31/dr-fritz-kahn-and-medical-infographics/ By 1942, besides politics, infographics were by this time covering other topics such as art, culture, poetry, and film. Refer to Figure 1-23.
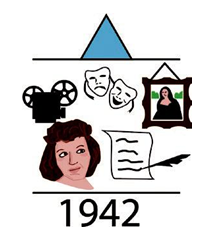
Figure 1-23. Pictorial example of the popular topics for infographics in the 1940s
In 1952, data visualization specialist Mary Eleanor Spear (1897–1986) further expanded upon the bar chart with the range bar, which later became the box and whisker plot in 1970, created by John Tukey. Refer to Figure 1-24.
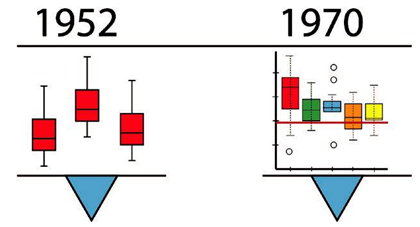
Figure 1-24. Pictorial example of box and whisker plot charts of 1952–1970
By 1972 and 1973, infographics on gold-anodized aluminum plaques became an important part of Pioneer 10 and Pioneer 11 spacecrafts, in the hope that their graphical meanings would be understandable to extraterrestrial beings, who would have no conception of our human language. Refer to Figure 1-25.

Figure 1-25. Pictorial sketch of part of the infographic on the Pioneer spacecraft plaques
However, as we will look at infographics later, that is one of the concerns, if not created correctly; they can be so visually appealing to the point of losing the point of the information contained within them. The second concern is that infographics, as data changes, can lose relevance. Since Pluto (Planet 9) was demoted to a dwarf planet in 2006 and some rings around the other gas giants were not known until later as well. Refer to Figure 1-26.

Figure 1-26. Pictorial sketch of part of the infographic on the Pioneer spacecraft plaques in regard to the sun and our solar system
Other notable people who joined the discussion and development of infographics in the twentieth century included visual artist Isidore Isou, philosopher Stephen Toulmin, lecturer/writer Edward Tufte, and Peter Sullivan, an infographic creator from 1970 to 1990 for the British newspaper, The Sunday Times.
In the years 1985–1987, as the computer was gradually becoming a popular drawing tool, Adobe Inc. created the scalable vector drawing program we know today as Adobe Illustrator. However, it was not until 1993 that graph creation was added to the program. Over the following years, many of the application tools that we use today to create our infographics were added. Refer to Figure 1-27.
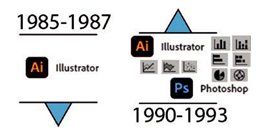
Figure 1-27. Introduction of Illustrator and its graphing tools along with Photoshop
Adobe Photoshop: It should be noted that was released in the 1990s and was not usually used for initial infographic creation and more for touching up photographs. It would over time become another key application in the acquisition of the sketch and then for the enhancement of the final infographic, where Illustrator, in earlier versions, could not add subtle shadows, gradients, and textures to its vector graphics. Photoshop was then needed to successfully create a raster or pixel-rendered version in a high resolution for final output for print.