1901 AD–2000 AD – What Are Infographics?-1
In 1900, charts and graphics continued to be popular and published. Refer to Figure 1-17.
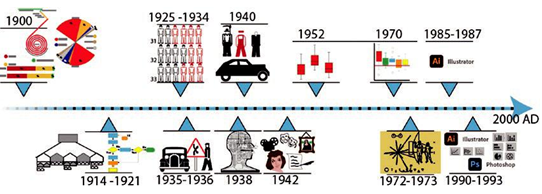
Figure 1-17. Pictorial timeline of 1901–2000 AD
Notable users include W. E. B. Du Bois where he and his team created 60 data visualization charts about the lives of Black Americans. Refer to Figure 1-18.
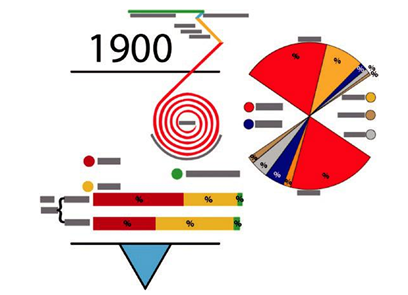
Figure 1-18. Pictorial examples of three of Du Bois’s data visualization charts
While the first organizational chart was developed in 1854, it was not called this until 1914. However, it was not until the 1920s that they began to be used more frequently, along with the flow process chart in 1921. Though they are not as appealing with only rudimentary shapes, text, and colors, their main purpose is to show order and flow direction or an action or sequence of actions. Refer to Figure 1-19.
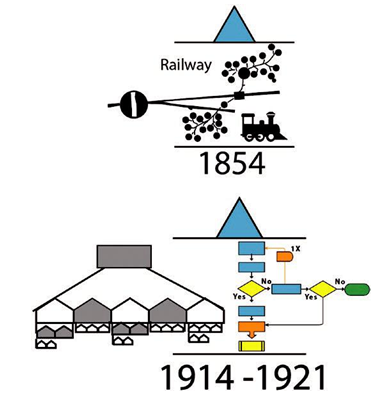
Figure 1-19. Pictorial examples of org and flow process charts
From around 1925 to 1934, Isotype or the International System of Typographic Picture Education developed out of the art movement, known as Cologne Progressives in Germany. Originally, it was called the Vienna Method of Pictorial Statistics, whose founding director of this museum was Otto Neurath (1882–1945). He was the initiator and chief theorist of the Vienna Method. Gerd Arntz (1900–1988) was the artist responsible for realizing the graphics. However, in 1935, the term for these types of graphics was changed to Isotypes after its key practitioners were forced to leave Vienna because of the rise of Austrian fascism and World War II. It was Neurath’s partner Marie (later his wife) who chose the new name, and she worked together with him and Arntz. Refer to Figure 1-20.
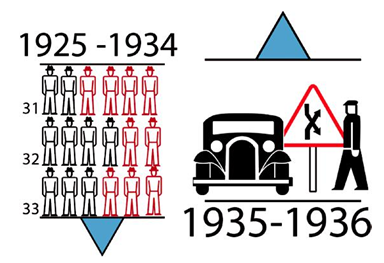
Figure 1-20. Pictorial example of some of the Isotypes created by Arntz with Neurath and Neurath’s wife
During this time and into the 1940s, Rudolf Modley (1906–1976), a graphic designer, popularized, developed, and standardized these kinds of symbols in the United States where he was later to join an organization called Glyphs Inc. Refer to Figure 1-21.
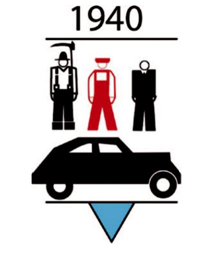
Figure 1-21. Pictorial example of some of the Isotypes created by Modley
Isotypes are a method of showing standardized social, technological, biological, and historical connections in pictorial form. Some isotypes were later developed into the road signs and traffic symbol icons we see as we travel in the car today. We will look at developing some examples of Isotype creation or as they are now called icons and apply them to a layout in Chapters 6, 7, 8, and 9.
Fritz Kahn (1888–1968), a physician, was one of the main pioneers of the modern infographic from 1938 to the 1950s, comparing the parts of the body to machines, like cars or motors, in his commission illustrations. Refer to Figure 1-22.
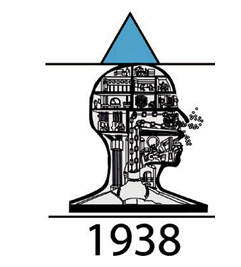
Figure 1-22. Pictorial sketch of an infographic by Kahn and his team of artists
Though he did not create the drawings himself but worked with a team of artists as is often done today as part of design collaboration, this will be a discussion point in Chapter 2.